Discover the price of installing artificial grass in Altadena. Explore the various factors that can impact the cost and make an informed decision.

This is a live article that we are updating with fresh data, insights, and statistics on the artificial grass business.
See the jewel insights from the local artificial grass company operating in Los Angeles, CA. We tried to compile unique and specific information about the residential artificial grass business.
Feel free to use the data in any way or format you desire as long as you provide a quote with a link. We have got more insights! Contact us with your specific needs and we will be happy to help you.
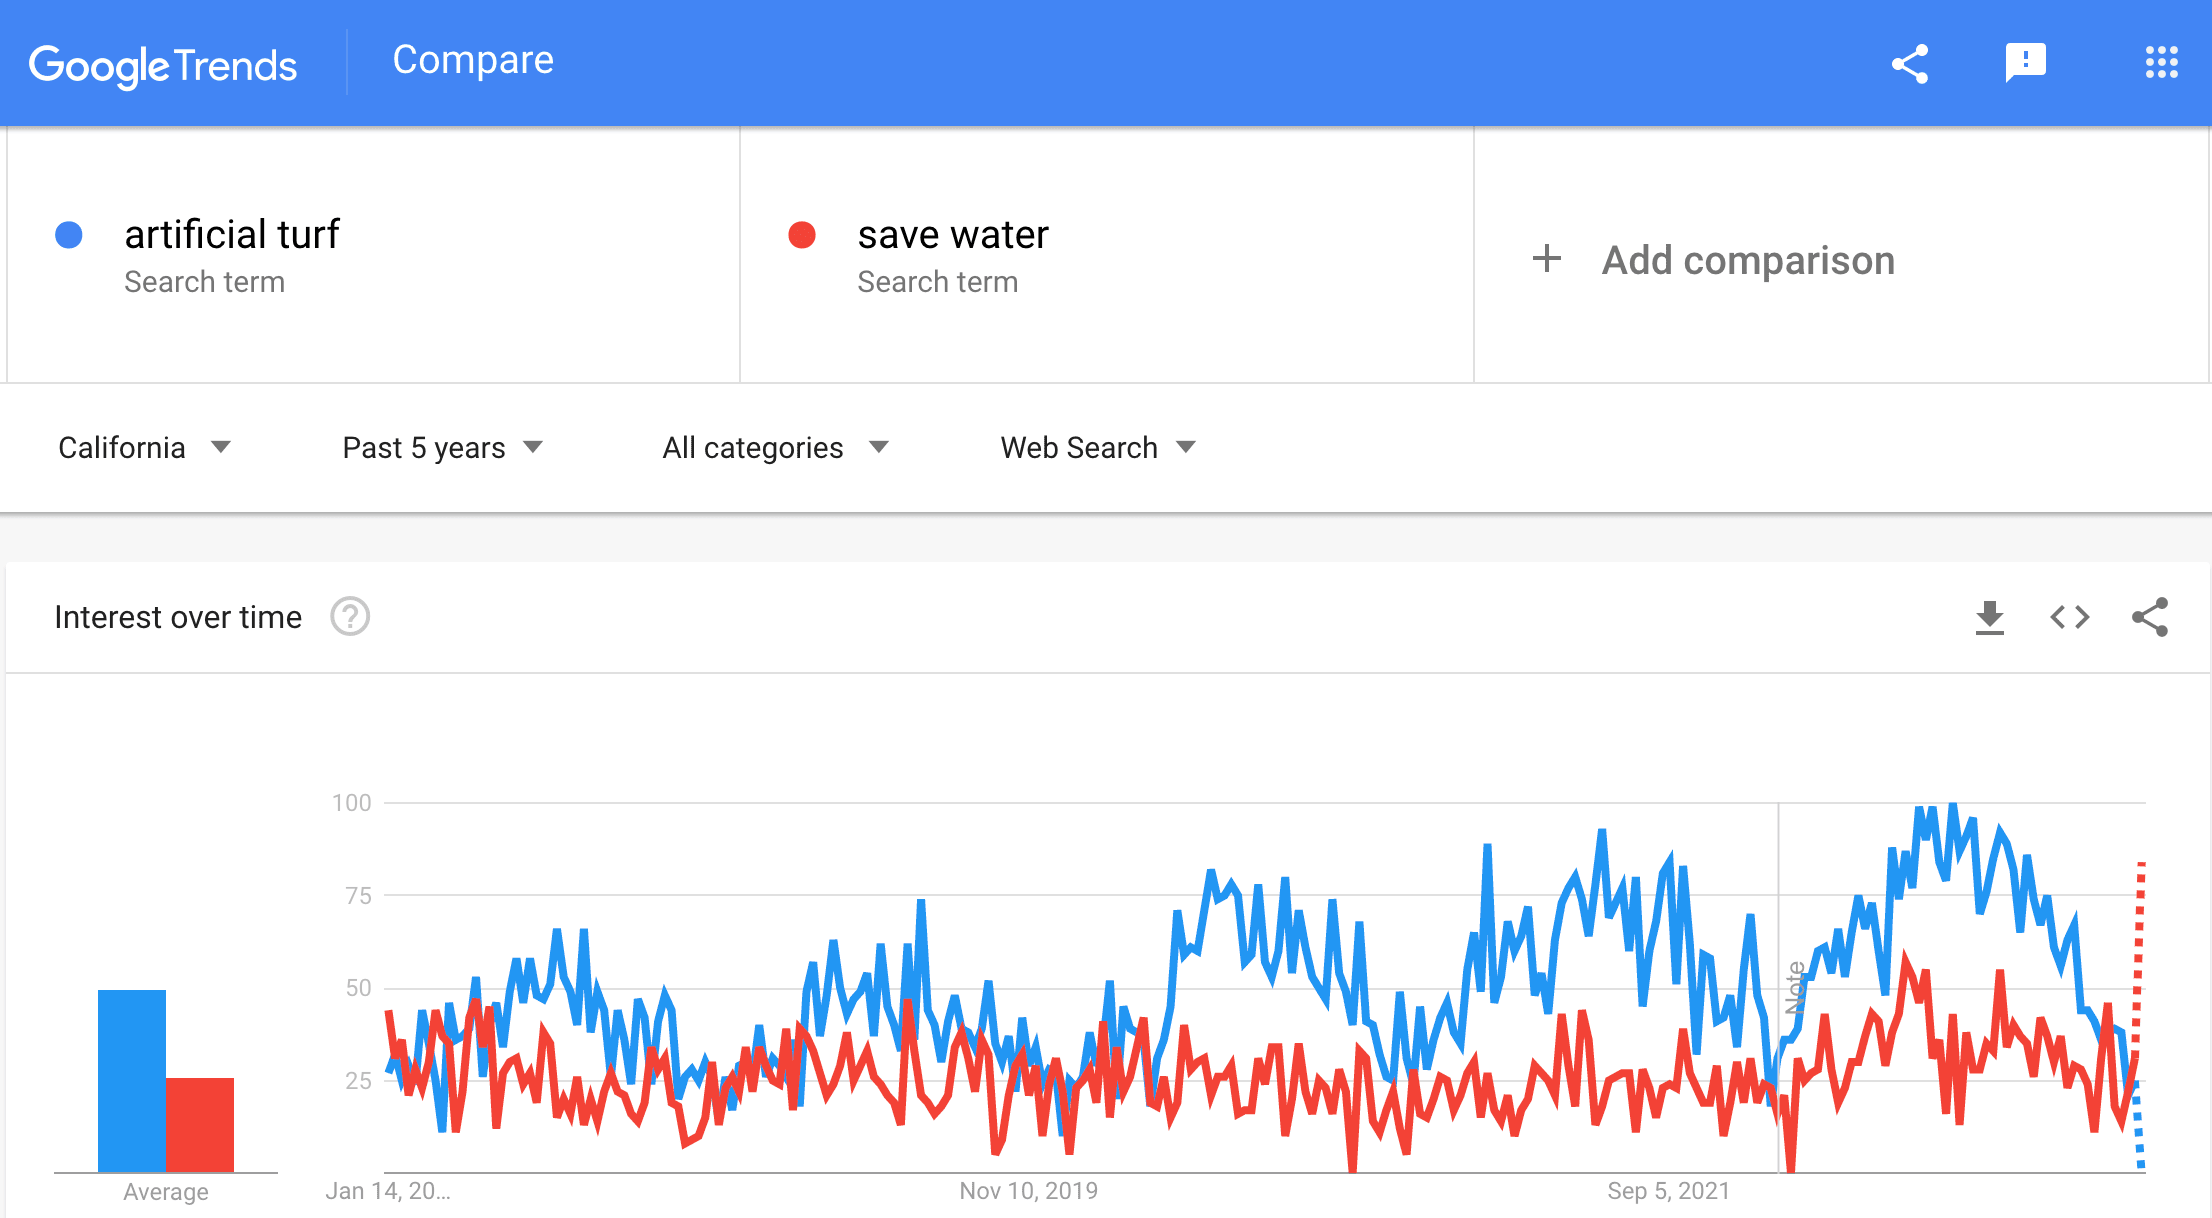
The interest in installing artificial turf in California increased 1.5x in the last 5 years. Many artificial grass installers report doubling the number of installation requests.
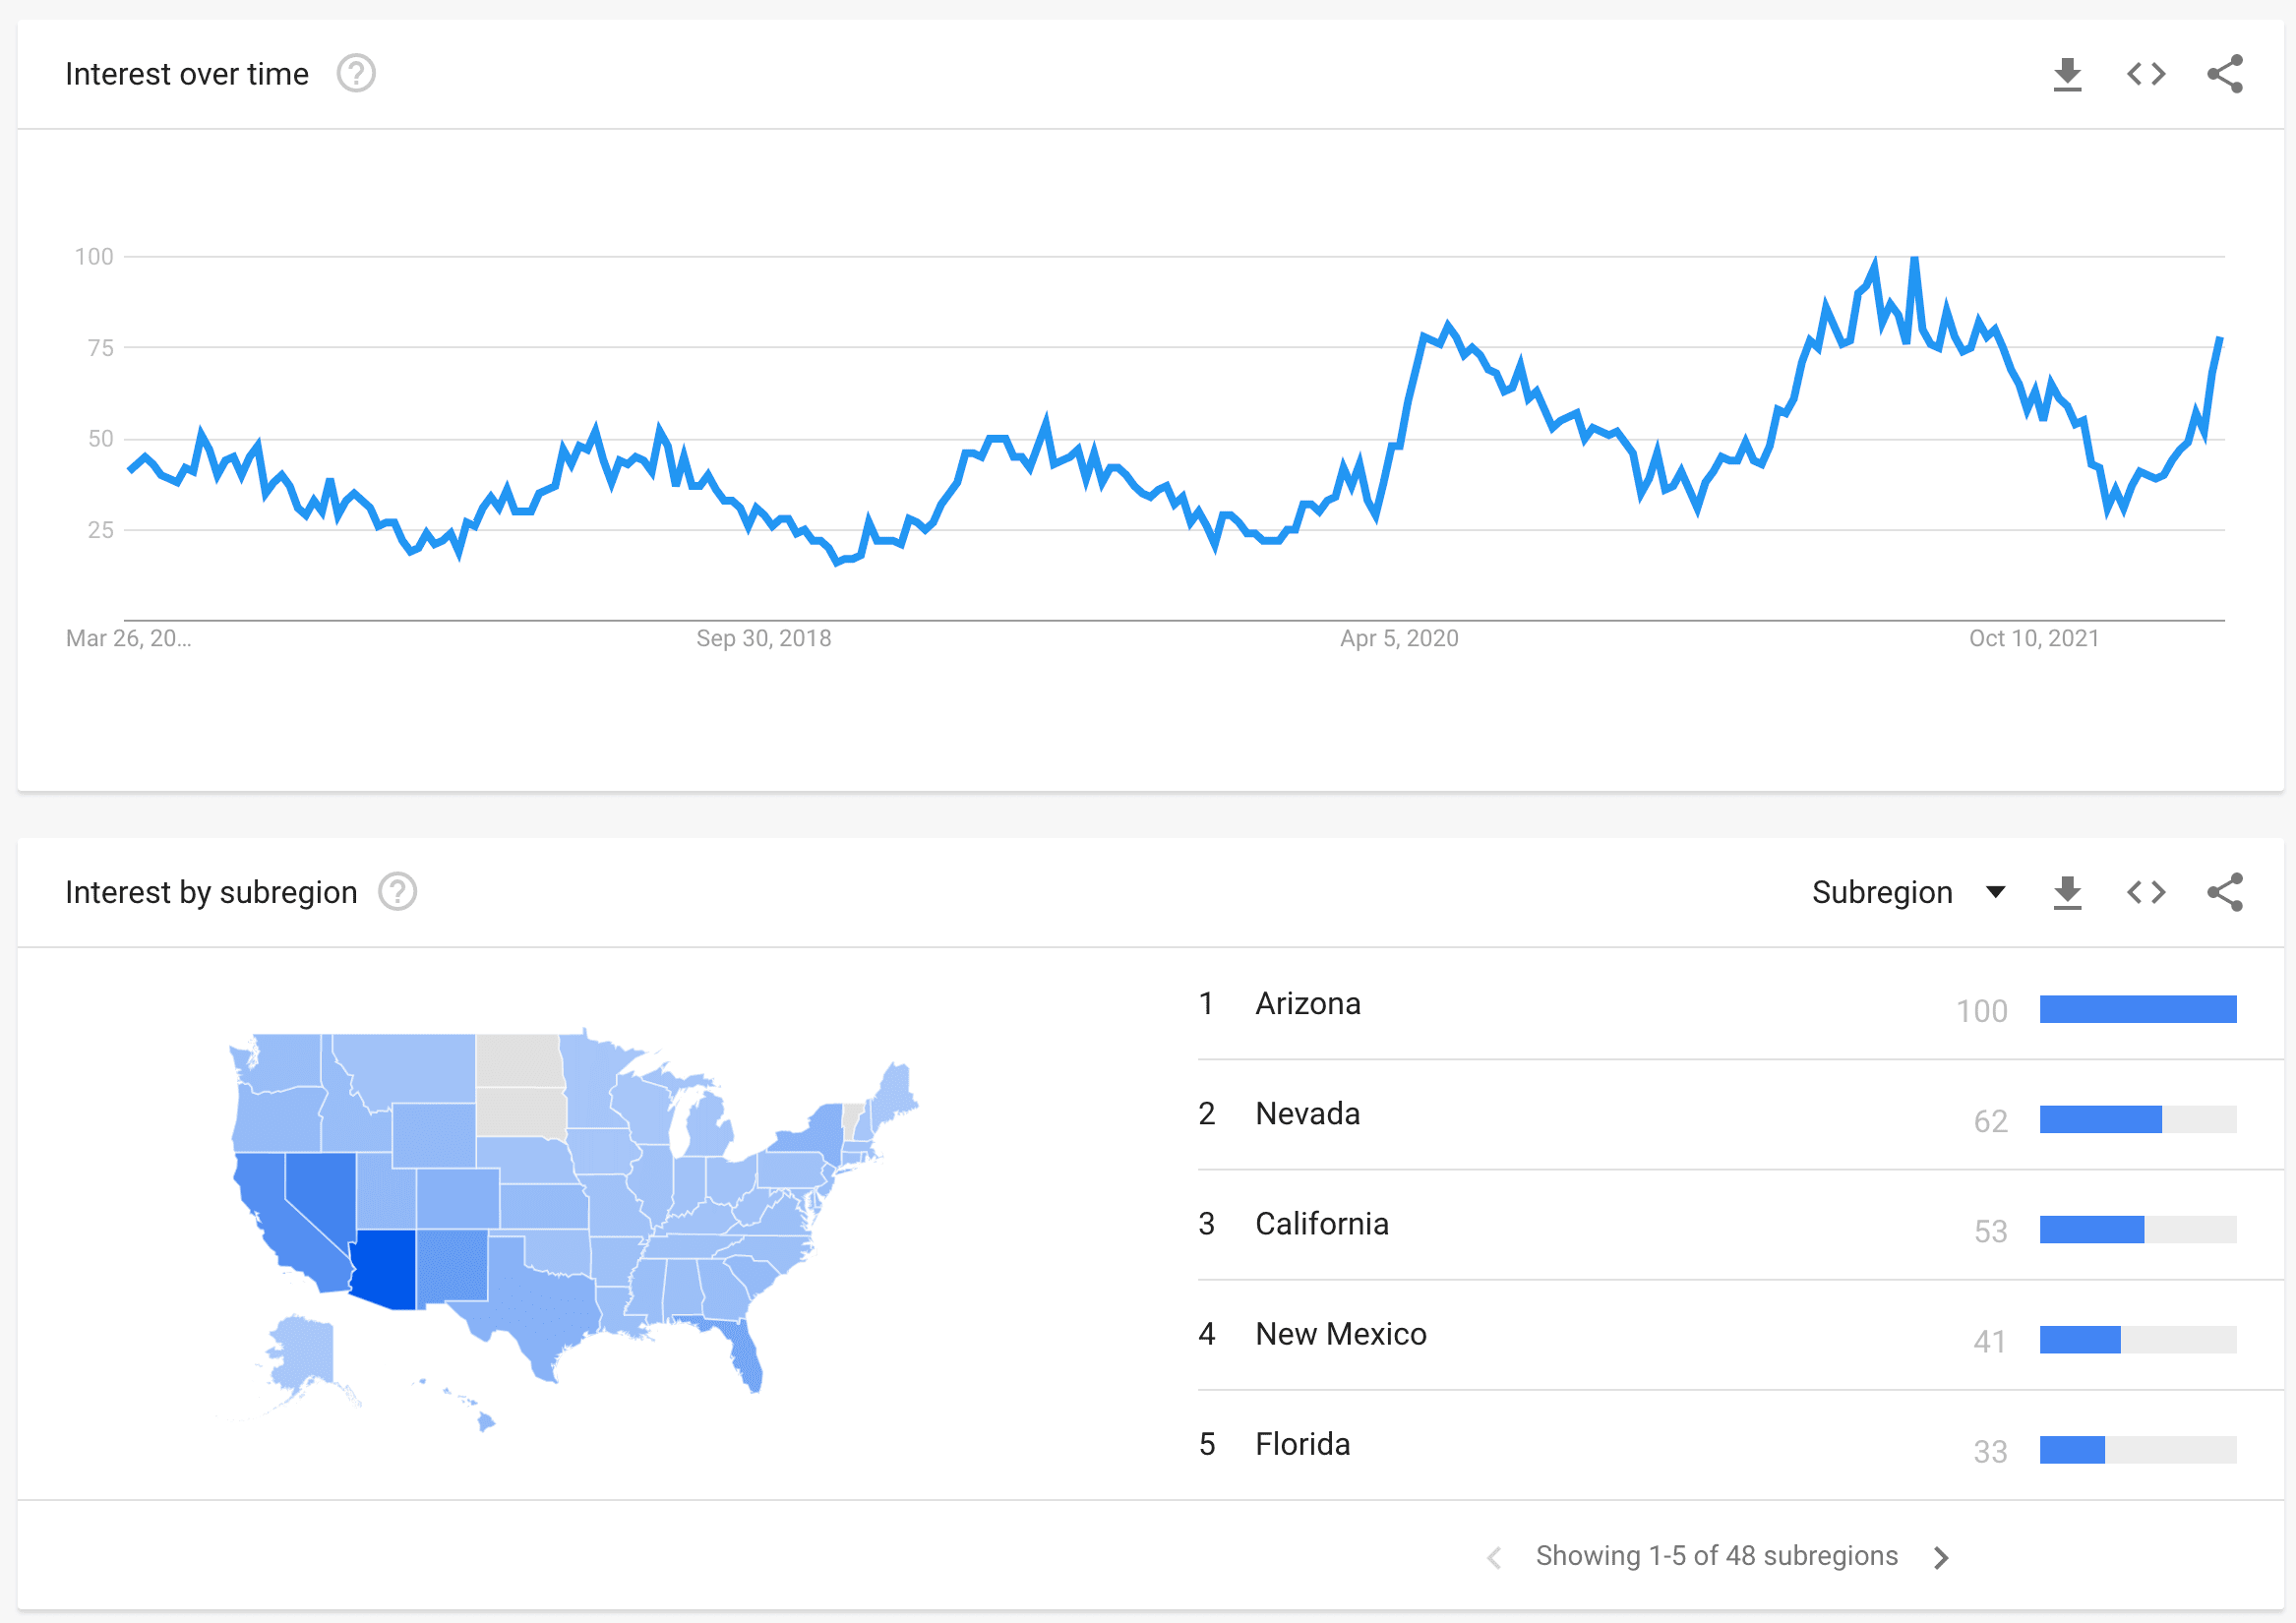
Arizona State is leading the race for artificial grass installation requests. Followed by Nevada, California, New Mexico and Florida.
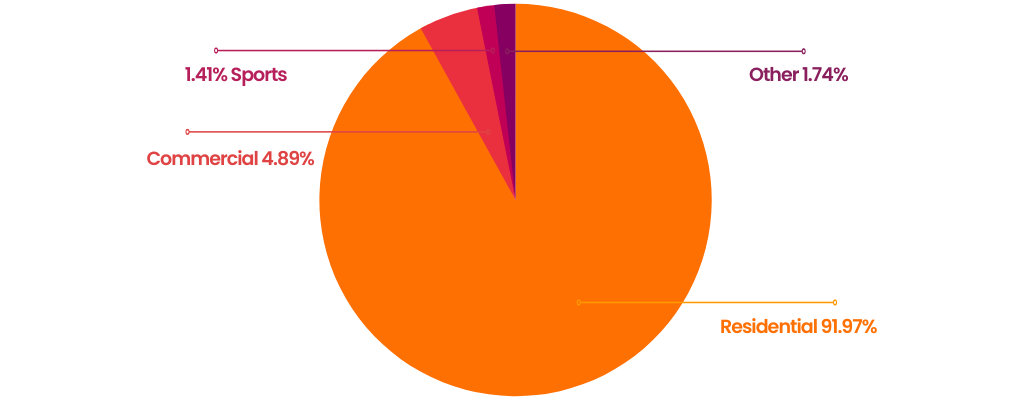
Nearly 92% of our requests and leads in 2022 were stemming from residential homeowners. This number continues to rise are artificial grass installation becomes more widespread throughout California. As water restrictions and conservation efforts tighten up, we're seeing more homeowners consider making the switch.
Commercial projects follow accounting for 4.89% of overall turf quote requests. This includes dog daycares, schools, hotels, and more. Lastly, we have artificial sports surfaces and other, which combined only attributed to 3.15% of contacts in 2022.
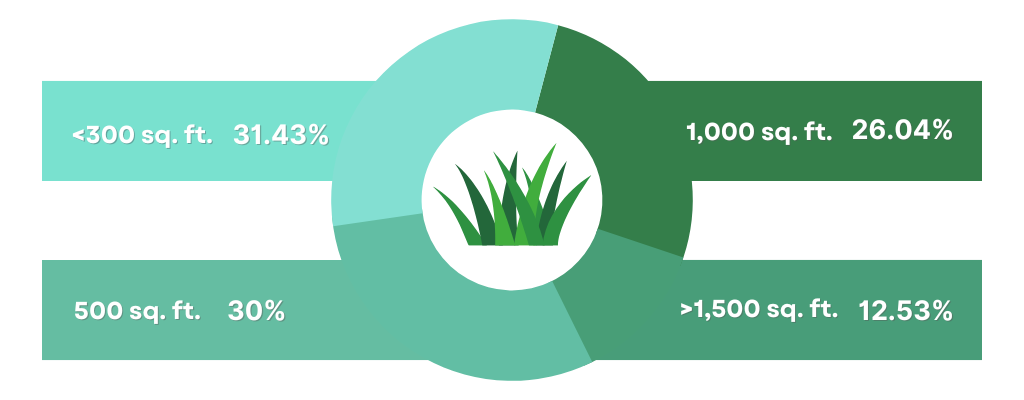
As you can see, the shares for the artificial grass project size is a bit more evenly spread. Taking the majority, are projects that are smaller than 300 sq. ft. Often we find that homeowners looking for turf installation in a small area will gather many bids because these projects cost more per sq. ft. Those who are looking for a low-cost turf installation will reach out to many artificial grass installers in search of the best deal.
In a close second is 500 sq. ft. accounting for 30% of our turf project requests and in third 1,000 sq. ft. at 26.04%. Between 500-1,000 sq. ft. is a typical size for front or backyard projects and are the jobs we complete most often.
Large projects over 1,500 sq. ft. attributed 12.53% of our contact leads in 2022. Most often, these projects are for commercial or public use spaces. Homeowners looking to convert their entire property to artificial turf will often also fall into this category.
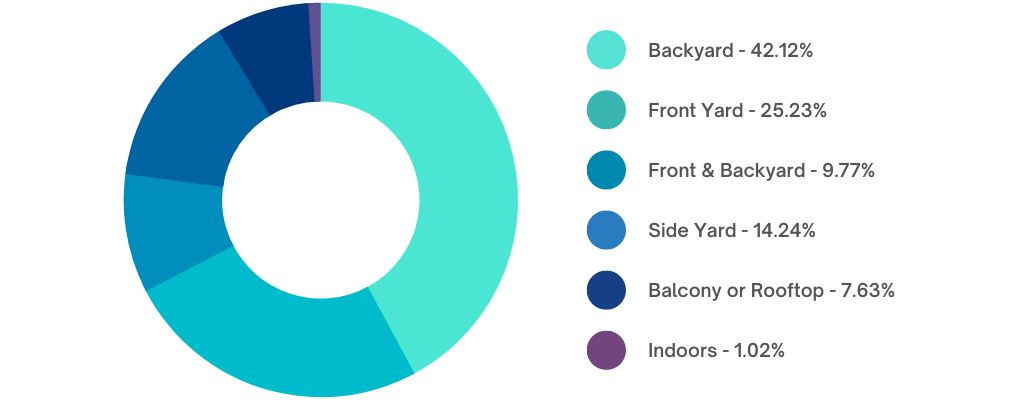
It's no surprise that over 42% of our prospected clients are looking for backyard artificial turf installation. Many deal with dry patchy natural lawns that turn to mud during the wet season. For most, artificial grass installation is the best way to bring life to their lawn and create a usable space again for the family. Followed by front and side yard, these are also common places to install artificial grass. Often we see homeowners creating dog runs with turf in the side yard.
Accounting for nearly 8% of overall synthetic grass requests is installation on a balcony or rooftop. Turf installation for balconies is becoming more common and provides a soft, plush, and green space for those who may not have lawn space. Because this type of turf installation is DIY friendly, we also receive many requests from clients looking to buy artificial grass for DIY installation on rooftops and balconies.

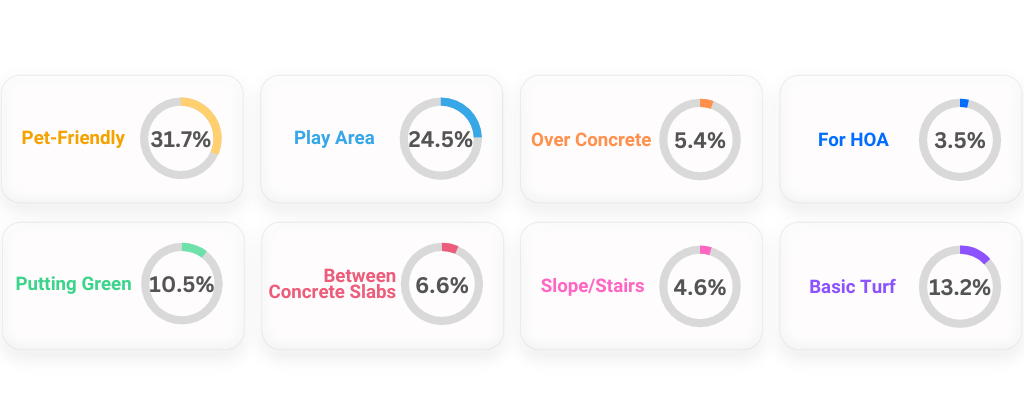
Above you'll see what intended uses are top of mind for our clients. We ask our customers which of these factors are relevant to their artificial turf project to learn more about their needs and ensure we're making the best recommendations. Nearly 32% of our prospected leads are concerned about Installing artificial turf that's pet friendly while 24.5% are looking to create a backyard play area. These two requests are the most common among our residential clients, and often these homeowners are looking for artificial grass that suits both young children and pets.
We've also seen outdoor putting green requests gain traction in the past few years, accounting for over a tenth of our overall client contacts in 2022. Many are taking advantage of the customization and fine tuning allowed with synthetic greens, and love the convenience of having their own backyard golf green.
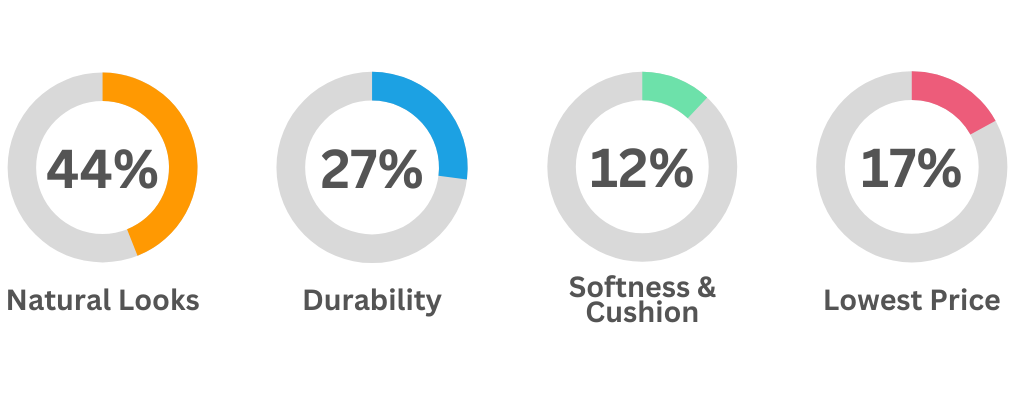
44% of people looking to install artificial grass in Los Angeles said natural looks was the most important feature. This is a common concern among those considering making the switch to synthetic turf. Followed by 24% looking for durability, this is especially important in high traffic or pet-friendly areas. It's interesting that only 17% prefer the lowest price. This tells us that while homeowners are always looking for the best deal, what they desire most is a natural looking artificial lawn that's installed right and will last for years.
We've also broken down all of our data by project size to better understand what factors are most common among different sized jobs. There are many trends we see within these numbers. For example, a good majority of the leads that are for >300 sq. ft. have more urgency to complete and selected that they needed it done yesterday. We can also see that customers with small artificial grass projects desired a low price more than natural looks or durability - this may be because small projects cost more per sq. ft. Check it out below to learn more!
| PROJECT TYPE | <300 sq. ft. | 500 sq. ft. | 1,000 sq. ft. | >1,500 sq. ft. |
|
Residential |
32.54% |
30.63% |
26.46% |
10.37% |
|
Commercial |
20.83% |
22.92% |
18.75% |
37.5% |
|
Sports |
0% |
33.33% |
33.33% |
33.33% |
|
Other |
26.67% |
13.33% |
20% |
40% |
| PROJECT LOCATION | <300 sq. ft. | 500 sq. ft. | 1,000 sq. ft. | >1,500 sq. ft. |
|
Front Yard |
24.34% | 27.57% | 31.38% | 16.72% |
|
Backyard |
24.26% | 31.36% | 30.18% | 14.20% |
|
Side Yard |
30.22% | 23.74% | 26.62% | 19.42% |
|
Front & Backyard |
6.20% | 16.67% | 42.71% | 34.38% |
|
Entire Property |
0% | 0% | 29.17% | 70.83% |
|
Balcony/Patio |
58.98% | 16.67% | 14.10% | 10.26% |
|
Indoor |
28.57% | 14.29% | 21.43% | 28.57% |
| INTENDED USE | <300 sq. ft. | 500 sq. ft. | 1,000 sq. ft. | >1,500 sq. ft. |
|
Basic Turf |
38.01% | 23.98% | 24.56% | 13.45% |
|
Pets |
28.19% | 31.87% | 28.43% | 11.52% |
|
Play Area |
24.76% | 33.33% | 31.75% | 10.16% |
|
Stripes |
29.55% | 22.72% | 30.68% | 17.04% |
|
Putting Green |
32.62% | 24.11% | 24.11% | 17.73% |
|
Over Concrete |
41.10% | 23.29% | 16.44% | 19.18% |
|
HOA |
34.78% | 26.08% | 28.26% | 10.87% |
|
Slope/Stairs |
13.11% | 36.07% | 31.15% | 19.67% |
| DESIRED FEATURE | <300 sq ft. | 500 sq. ft. | 1,000 sq. ft. | >1,500 sq. ft. |
|
Natural Appearance |
27.83% | 28.08% | 32.76% | 11.33% |
|
Durability |
30% | 32.40% | 21.60% | 16% |
|
Softness/Cushion |
34.26% | 32.41% | 20.37% | 12.96% |
|
Low Price |
40.51% | 29.11% | 19.62% | 10.76% |
| URGENCY | <300 sq. ft. | 500 sq. ft. | 1,000 sq. ft. | >1,500 sq. ft. |
|
Just Browsing |
27.14% | 38.57% | 25.71% | 8.57% |
|
When Price is Best |
29.34% | 27.44% | 29.34% | 13.88% |
|
In the Next 2-3 Weeks |
33.75% | 31.23% | 24.92% | 10.09% |
|
I have a deadline |
22.39% | 26.87% | 23.88% | 26.87% |
|
Needed Yesterday |
37.09% | 29.80% | 21.85% | 11.26% |

Discover the price of installing artificial grass in Altadena. Explore the various factors that can impact the cost and make an informed decision.
Discover the price of installing artificial grass in West Hollywood. Explore the various factors that can impact the cost and make an informed decision.
>> Request a...